

East Bay vs. Peninsula: Where Should You Buy a Rental Property?

September 21, 2026

By: Jian Hui Zhu, Real Estate Broker (DRE #02129313)

Published by ETRO Group Inc. (DRE #02441215)

Share this article

When evaluating Northern California real estate, the cross-bay debate comes down to a fundamental question: are you hunting for immediate cash flow and yield, or prioritizing long-term capital preservation and elite appreciation?


Both markets offer compelling pathways, but they operate in entirely different orbits — attracting distinct investors, demanding separate capital, and carrying unique operational hurdles. Let's dissect both.


1. Capital Outlay & Entry Price

The East Bay: Accessibility & Diversification

ETRO Group manages across the East Bay & Tri-Valley.

  • Asset pricing: premier submarkets (Lafayette, Walnut Creek, Berkeley Hills) run $1.4M–$2.1M, but rental stock in Hayward, San Leandro, Concord, or parts of Oakland starts around $650K–$1.1M.
  • County baseline: Alameda County's median home value hovers around $1.08M–$1.1M.
  • Strategic advantage: a lower floor lets capital stretch — acquire multiple doors across submarkets instead of one $2M Peninsula asset, insulating against localized vacancy.


The Peninsula: High-Capital, Supply-Constrained Luxury

ETRO Group also covers the Peninsula & Silicon Valley.

  • Asset pricing: San Mateo County's SFH median runs ~$1.8M–$1.93M ($1,070–$1,270+/sq ft); trophy markets like Atherton and Menlo Park push from $2.8M past $5M to $8M+.
  • Strategic requirement: heavy capital, jumbo financing, or all-cash — restricting participation to institutional players and high-net-worth buyers who accept low initial yields for structural safety.


2. Yield, Cap Rates & Cash Flow

East Bay Yield

  • Cap rates: generally 4.5%–6.5%.
  • Rent-to-price: average Alameda County rents near $2,895 paired with sub-million acquisitions provide a shorter path to neutral or positive cash flow.
  • Value-add: cosmetic updates or ADU additions (where permitted) can meaningfully lift yield.


Peninsula Yield

  • Cap rates: a compressed 3.8%–5.2%, often 3.85%–4.10% for pristine Class A stock in Palo Alto or Menlo Park.
  • The cash-flow deficit: even with rents of $3,760+, valuations outpace rents — many SFH rentals run negative cash flow at acquisition, functioning as equity-accumulation vehicles rather than income generators.


3. Micro-Market Breakdown

East Bay Submarkets

  • Hayward & San Leandro: transit corridors with $750K–$1.2M stock, capturing spillover demand via BART and freeways.
  • Oakland & Berkeley: dynamic urban centers; Berkeley anchored by UC demand, Oakland offering diverse stock (weigh local tenant laws).
  • Concord & Walnut Creek: lower price-per-sq-ft inland, with Walnut Creek serving affluent suburban renters.


Peninsula Submarkets

  • San Mateo & Redwood City: mid-Peninsula anchors ($1.4M–$1.8M) with a vibrant, walkable downtown drawing young tech professionals.
  • San Carlos & Foster City: a biotech-driven "boomburg" and stable, family-oriented master-planned living.
  • Palo Alto & Menlo Park: ground zero for tech wealth — Stanford, venture capital, and Meta campus pressure.


4. Tenant Demographics

  • East Bay mix: UC academics, healthcare staff, government employees, tech commuters, and creatives — deep, consistent demand, though some urban submarkets see higher turnover.
  • Peninsula corporate engine: senior engineers, biotech researchers, and executives anchored by Meta, Oracle, and Genentech — school-district-focused tenants who stay longer with exceptionally low default risk.


5. Regulatory Realities

  • East Bay: beyond AB 1482, cities like Oakland (Rent Adjustment Program) and Berkeley enforce strict general-adjustment formulas, registration mandates, and complex just-cause rules — requiring surgical precision.
  • Peninsula: most cities defer primarily to AB 1482 (with exceptions like East Palo Alto), meaning fewer overlapping municipal layers than Oakland or Berkeley.


6. Market Velocity & Liquidity

  • East Bay: median days-to-pending typically 15–30 days — balanced enough to leave room for contingencies and negotiation.
  • Peninsula: a high-velocity engine — SFH days-on-market of 9–14 days, sub-2-month supply, and sale-to-list ratios exceeding 104–106%.


Comprehensive Summary Matrix

Metric The East Bay The Peninsula
Median entry (SFH) $700K–$1.3M (county ~$1.1M) $1.4M–$2.8M+ (county ~$1.8M–$1.93M)
Average rents $2,500–$3,400 $3,400–$5,000+
Cap rates 4.5%–6.5% (higher yield) 3.8%–5.2% (appreciation-focused)
Primary tenants Academics, healthcare, diverse commuters, families Tech execs, biotech scientists, VC professionals
Regulation Complex local boards (Oakland RAP, Berkeley) Primarily statewide AB 1482
Velocity (DOM) 15–30 days 9–14 days (extremely competitive)

Choose the East Bay for a lower barrier to entry, cash flow, and diversification across multiple doors. Choose the Peninsula for capital preservation, generational equity, and liquidity — backed by stable, high-income tenants who treat rentals as long-term roots.

Deciding where to deploy your next investment dollar?

ETRO Group pairs deep local market intelligence with full-service management across the East Bay, Silicon Valley, and the Peninsula.

Frequently Asked Questions

Is the East Bay or Peninsula better for cash flow?

Why do Peninsula rentals often run negative cash flow?

Which market has stricter rent control?

⚡ KEY TAKEAWAYS

  • The East Bay offers lower entry (~$700K–$1.3M) and higher yield (4.5–6.5% cap rates).
  • The Peninsula demands heavy capital ($1.4M–$2.8M+) for appreciation over cash flow.
  • East Bay = cash flow & diversification; Peninsula = capital preservation & liquidity.
  • The East Bay has stricter local rent boards (Oakland RAP, Berkeley); the Peninsula mostly defers to AB 1482.
  • Peninsula homes move in 9–14 days; East Bay inventory in 15–30 days.

Disclaimer: This article is informational only and not investment, tax, or legal advice. Prices, rents, and cap rates are approximate and change over time; consult ETRO Group and your own advisors before investing.

Recent Posts

Bay Area rental property storm preparation checklist
September 24, 2026
A Bay Area landlord's storm-season checklist: gutters and drainage, tree and wind hazards, HVAC service, weatherstripping, smoke and CO alarms, plus the habitability duties California law puts on owners during severe weather.
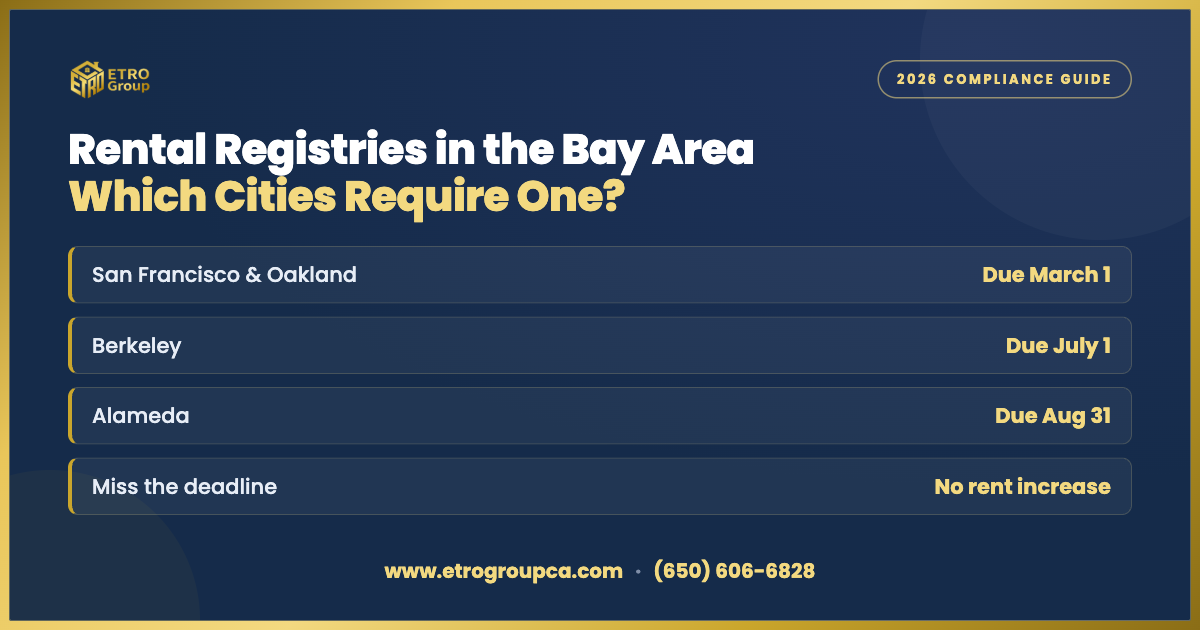
Rental registries in the Bay Area: which cities require one
September 14, 2026
Which Bay Area cities require rental registration — San Francisco, Oakland, San Jose, Berkeley, Alameda, Richmond & Concord — plus deadlines, fees, and non-compliance penalties.
Silicon Valley Rental Market Report 2026: Rents, Trends & Forecast
September 7, 2026
Silicon Valley's 2026 rental market: median rents by submarket, the AI and return-to-office demand surge, sub-5% vacancy, and a 6-7% rent-growth forecast.

Section 8 in Alameda County: The Landlord Compliance Guide
August 31, 2026
California's source-of-income law (SB 329) for Alameda County landlords — what income is protected, prohibited ad language, and correct income-to-rent math.

7 Signs It’s Time to Hire a Property Manager in the Bay Area
August 24, 2026
Seven clear signs you need a Bay Area property manager — from complex tenant laws and long vacancies to distance, tenant conflict, and a scaling portfolio.

August 16, 2026
California just-cause eviction in 2026 — AB 1482's 12-month trigger, at-fault vs no-fault grounds, Bay Area local ordinances, relocation fees, exemptions, and pitfalls to avoid.

California Security Deposit Law 2026: What Landlords Can & Can't Do
August 10, 2026
California's 2026 security deposit rules — AB 12's one-month cap, AB 2801 move-in/move-out photo mandates, the 21-day clock, and AB 414's electronic refund rule.

Tenant Screening in California 2026: A Step-by-Step Landlord Guide
August 3, 2026
California tenant screening in 2026: the $65.86 fee cap, written criteria, source-of-income rules, criminal background limits, adverse-action notices, and record-keeping.
2026 Bay Area rent increase limits by city
July 27, 2026
2026 Bay Area rent increase limits by city — SF 1.6%, Oakland 2.3%, Berkeley 1.0%, San Jose 5%, statewide AB 1482 8.8%. Know which rule applies.
Bay Area property management fee breakdown 2026
July 20, 2026
Bay Area property management fees run 6–12% of rent in 2026. See the full fee breakdown, hidden add-ons, and when management pays for itself.
Show More